
As a part of MSA project week, Best Buy challenged us to come up with a model that could accurately and efficiently predict sales of hundreds of low-selling SKUs (Stock-Keeping Units). We were given several years worth of data for each SKU, containing information such as price, units sold, sales, and competitor pricing.
Since runtime was a key issue mentioned by the Best Buy team, we wanted to choose a model that could quickly get the job done. We utilized Microsoft Azure AutoML to select the best model. The result this was a Seasonal Autoregressive Moving Average (SARIMA). Running the SARIMA was a different story, as it would crash the Kernel on a consistant basis. We then decided to try our second best model, a seasonal naive model.
After reading in the data into a pandas dataframe and doing some inital data cleaning, it was time to start writing functions. The first function was taken from Sandeep Pawar and generated the naive model. Pawar had some things incorrect in his function, so I had to go back in and correct these errors.
def pysnaive(train_series,seasonal_periods,forecast_horizon):
    '''
    Python implementation of Seasonal Naive Forecast.
    This should work similar to https://otexts.com/fpp2/simple-methods.html
    Returns two arrays
     > fitted: Values fitted to the training dataset
     > fcast: seasonal naive forecast

    Author: Sandeep Pawar
    Edited by: Andrew Crawford

    Date: Apr 9, 2020
    Edited Date: Jan 18, 2023

    Ver: 1.1

    train_series is the training data you will use to train the model.
    seasonal_periods is the 'lag' on the naive model. A value of '7' is a 1 week lag
    forecast_horizons is the number of days you want to predict for
    '''
    import numpy as np

    if len(train_series)>= seasonal_periods: #checking if there are enough observations in the training data

        last_season=train_series.iloc[-seasonal_periods:]

        reps=np.int(np.ceil(forecast_horizon/seasonal_periods))

        fcarray=np.tile(last_season,reps)

        fcast=pd.Series(fcarray[:forecast_horizon])

        fitted = train_series.shift(seasonal_periods)

    else:
        fcast=print("Length of the trainining set must be greater than number of seasonal periods")

    return fitted, fcast
After loading in this first function, I wrote a function to calculate Root Mean Squared Error (RMSE) for each of the given SKU. I repeated the function once the validation data was given, which is given below
def all_sku_valid(seasonal):
    rmse_list = []
    sum_rmse = 0
    vals = dfval['Encoded_SKU_ID'].unique() #we had to use only SKUs in the validation set since there were fewer than in the training set.
    vals = list(sorted(vals))
    for i in vals:
        #print(i)
        dfvalid = dfval.copy()
        df2 = df.copy()
        df2 = df2[df2['Encoded_SKU_ID']==i]
        dfvalid = dfvalid[dfvalid['Encoded_SKU_ID']==i]
        df2 = df2.set_index('SALES_DATE')
        dfvalid = dfvalid.set_index('SALES_DATE')
        dfvalid = dfvalid.sort_index()
        df2 = df2.drop(columns = ['Encoded_SKU_ID' , 'RETAIL_PRICE', 'Inventory', 'class_code', 'subclass_code'], axis =1)
        dfvalid = dfvalid.drop(columns = ['Encoded_SKU_ID' , 'CLASS_NAME', 'SUBCLASS_NAME', 'ML_NAME', 'CATEGORY_NAME', 'RETAIL_PRICE', 'PROMO_PRICE', 'COMPETITOR_PRICE', 'Inventory',
                                         'Forecasted Units', 'CP2','PP2'], axis =1)
        training_set = df2
        test_set = dfvalid
        liltrain = training_set[-60:] #last 60 entries of the original data
        predictions = dfvalid.copy() #predictions compared to the validation set
        py_snaive_fit = pysnaive(liltrain['DAILY_UNITS'],
                     seasonal_periods=seasonal,
                     forecast_horizon=7)[0]

        #forecast
        py_snaive = pysnaive(liltrain['DAILY_UNITS'],
                     seasonal_periods=seasonal,
                     forecast_horizon=7)[1]
        predictions["py_snaive"] = py_snaive.values
        acc = accuracy(predictions['DAILY_UNITS'], predictions['py_snaive']) #
        rmse_list.append(acc)
        sum_rmse+=acc
        #print(i ,',', acc)

    return sum_rmse
This version of the function returned the sum of the RMSE for all SKUs, but the function can easily be modified to return the average RMSE or the RMSE for every SKU. The total RMSE was 1367.19, or 2.53 per SKU.
For our model, we chose a seasonal value of 7, which corresponds to a week. This was due to the prediciton window also being a week, and since a naive model works by predicting the next X days by using the last X days, we decided to have our model mirror the last 7 days.
A graph of the results can be seen below, using SKU #144 as an example:
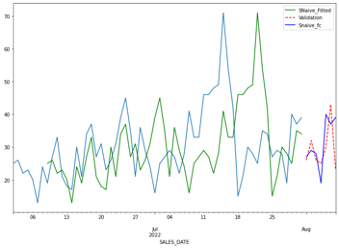
Overall, we were pretty happy with out results. The runtime was just over 2 minutes for all SKUs, which was quite quick. Although Best Buy did not select our model, we felt that it was solid considering the simplicity and speed.