
Welcome to my first blog post! The first thing I wanted to look at was something I had been thinking about for a long while.
Many of you may have heard of the idea that professional hockey players tend to be born in the first quarter of the year. This idea comes from the 2008 Malcolm Gladwell novel Outliers, where Gladwell uses this as an example about how birthdate impacts success. Gladwell’s explanation for this phenomenon is that in hockey-crazed Canada, youth hockey cutoffs tend to be January 1st. As a result, the players born in the first part of the year are the oldest in their particular cohort, and therefore have slight physical advantages (bigger, faster, and stronger) compared to their peers. As a result, these older players make better teams, get more playing time, and get better coaching, so by the time the players age and physical differences are negligible, the older players are more pro-ready.
I, however, had a few doubts about this theory and wanted to test it for myself.
The first thing to do is to read in the data and import packages. The data comes from quanthockey.com and from my own research.
import pandas as pd
import datetime
import matplotlib.pyplot as plt
import numpy as np
datatwenty = pd.read_csv('~/Documents/FALL 22/random hockey/random hockey 2.csv',header=0)
dataas = pd.read_csv('~/Documents/FALL 22/random hockey/random hockey 3.csv')
dataall = pd.read_csv('~/Documents/FALL 22/random hockey/random hockey 4.csv')
dataall=dataall.iloc[0:,0:2]
dataas=dataas.iloc[0:,:2]
monthh = datatwenty['Birth Date']
I had to convert the format of my dates in order to extract the birth months.
newdate=[0] * 20
monat=[0]*20
tempmon = [0]
for i in range(20):
    newdate= datetime.datetime.strptime(monthh[i], "%d-%b").date()
    tempmon = newdate.strftime("%m")
    monat[i] = tempmon

monint = [int(item) for item in monat]
allbm= dataall['Month']
allper = dataall['percentage of players']
asbm = dataas["BDAY"]
asmo = [0]*49
for i in range(49):
    asmo[i]= (datetime.datetime.strptime(asbm[i], "%m/%d/%y").date()).strftime("%m")
asint = [int(item) for item in asmo]
Now it is time to make the plots. The first plot is the percentage of NHL players born in each month.
allperint = [float(item.replace("%", "")) for item in allper]
plt.figure(figsize=(15,5))
plt.bar(allbm, allperint)
plt.xlabel('Birth Month')
plt.ylabel('Percentage of NHL Players')
plt.title('Percentage of NHL players Born in Each Month of the Year')
plt.show()
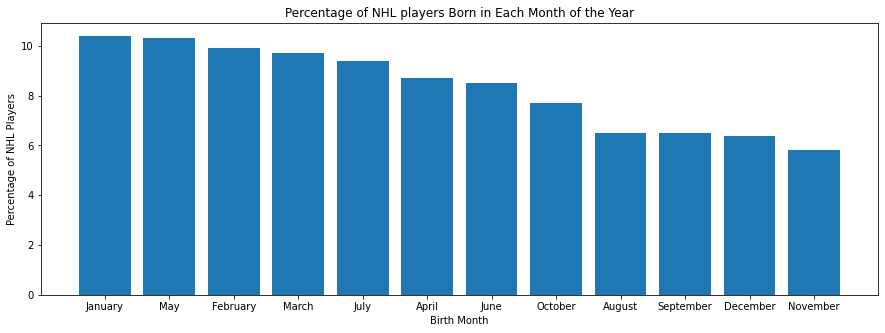
As is shown in the above graph, we can see the correlation between the month and the percentage of players. January has the most players, with February and March ranking 3rd and 4th. The last 5 months of the year are all the 5 least common birth months. It seems as though Gladwell’s theory holds here.
In the next graph, we look at a subset of the data, in this case NHL all-stars.
plt.figure(figsize=(15,5))
plt.hist(asint, bins=np.arange(1,14)-.5)
plt.xticks(range(1,13))
plt.yticks(range(0,10))
plt.xlabel('Month')
plt.ylabel('Number of Players Born')
plt.title('NHL All Stars by Birth Month')
plt.show()
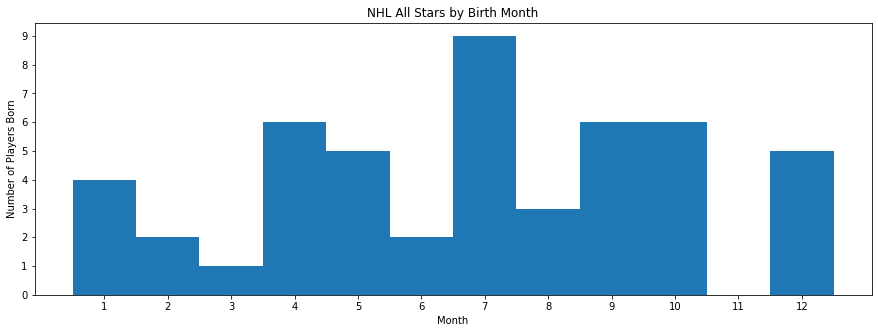
Interstingly, this graph doesn’t resemble the previous one. It seems like when we look at more elite NHL players, the effect of birth month is muddied. December has more all stars than January, and July has the most all stars (9). April, September, and October are all tied for second with 6 all stars each.
Now I’ll look at just the top 20 point scorers in the league last season.
plt.figure(figsize=(15,5))
plt.hist(monint, bins=np.arange(1,14)-.5)
plt.xticks(range(1,13))
plt.yticks(range(0,7))
plt.xlabel('Month')
plt.ylabel('Number of Players Born')
plt.title('Top 20 Point Scorers (21-22) By Birth Month')
plt.show()
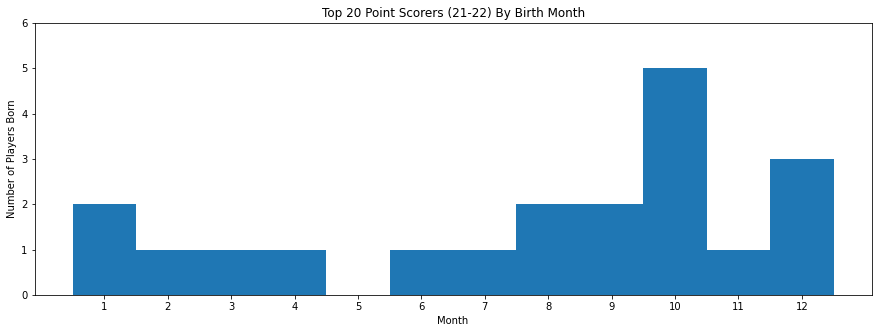
When we just look at the top 20 point getters in the 2021-2022 season, we see almost the opposite relationship between birth month and players. 14 of the top 20 point scorers were born after July 1st, and the same number of players were born in October (5) as were born between January 1st and May 31st.
While this is too small of a sample size to really form a conclusion, it is nevertheless very interesting to look at how the effect of birth month changes. Since Outliers is a novel about success and how we measure it, seeing the results of moving the goalposts ie changing the definition of success is worth looking at. If we change the definition of a success from just becoming an NHL player to becoming one of the 20 best point scorers, Gladwell’s theory about birth month would be reversed. I’m not sure what a valid explanation for this trend would be either. Perhaps players who are younger and therefore smaller have to be less reliant on size and speed and instead develop skills to compete. These skills could translate down the line to being a better hockey player. Of course, this is just a speculation I had, with no evidence to back this up. Perhaps someone with more youth hockey experience has a better theory.
This was an enjoyable first project to work on for the blog, and I look forward to continue posting in the future.